INTC eyes on $22.90: Golden Genesis fib that could mark "Bottom"Intel may now be the dinasaur of Chips.
The stock has been dumping for decades.
Last drop has bounced to major resistance.
It is PROBABLE that we "orbit" this fib a few times.
It is POSSIBLE that we reject for a "lower high" here.
It is PLAUSIBLE that we break and end the down trend.
================================================

2x or 3x your moneyLooks like it has come out of the consolidation mode and wants to go higher. It can 2x or 3x within a year. If that happens take it as a market top and sell.

TSLA
Key Observations:
Timeframe & Context:
The chart is set to a 1-hour timeframe for Tesla (TSLA).
It includes multiple timeframes for analysis on the right side, ranging from 2-minute to 1-week.
Indicators and Strategy Elements:
Entry & Exit Points: An entry point is marked, with a labeled Entry box, and several Take Profit (TP) levels: TP 1, TP 2, and TP 3.
Stop Loss & Trailing Stop Loss:
The initial Stop Loss is set below the Entry point.
A Trailing Stop Loss (TSL) is set above the Entry, indicated by the purple box.
Market Conditions:
The condition for most timeframes, including 2M, 5M, 15M, 30M, and 1H, shows a Buy signal.
However, the 1 Hour and 2 Hour timeframes also show a Sell signal for a short period, indicating a mixed trend in the shorter timeframes.
Trend and Market Meters:
The overall market condition is Bullish in multiple timeframes, while the shorter timeframes are experiencing a Sideway condition.
Indicators like Accumulation and Setup Buy confirm the bullish bias in larger timeframes.
Technical Indicators:
CIT (Change in Trend) signals are marked multiple times, confirming areas of trend reversal or continuation.
BOS (Break of Structure) is used to denote areas where the market broke through previous support or resistance levels.
Volume data and trend strength indicators are included below the chart, such as the AO (Awesome Oscillator) and RSI (Relative Strength Index), showing bullish strength currently.
Take Profit Levels:
TP 1, TP 2, and TP 3 are clearly defined.
TP 1 is at the 253 level, TP 2 is at 257, and TP 3 is at 261.
As the price progresses, each TP represents a strategic level to secure partial profits.
Suggested Strategy Analysis:
Entry & Stop Loss Setup:
Your Entry point is well-placed based on support/resistance confirmation.
Stop Loss placement below the support level provides a solid risk management strategy, protecting against unexpected reversals.
Trailing Stop Loss (TSL):
The use of a TSL above the Entry is designed to lock in profits as the price moves in your favor.
Consider incrementally adjusting the TSL if the price breaks above TP 1 and TP 2 to optimize gains.
Take Profit (TP) Management:
TP 1 serves as a conservative target, while TP 2 and TP 3 are positioned for higher gains.
Once TP 1 is hit, moving your Trailing Stop Loss to the Entry point is recommended, ensuring a no-loss position if the price reverses.
Market Condition Awareness:
Keep an eye on the 1-hour and 2-hour Sell signals for potential short-term resistance or pullback zones.
If these signals continue, consider scaling out partial positions at TP 1 or TP 2 and waiting for confirmation before holding to TP 3.
Final Recommendations:
Monitor for any break of support/resistance around the TP levels.
Adjust the Trailing Stop Loss dynamically as the price hits TP targets.
Use Volume and Momentum Indicators (AO and RSI) to validate the strength of the trend, especially if there are conflicting signals.Key Observations:
Timeframe & Context:
The chart is set to a 1-hour timeframe for Tesla (TSLA).
It includes multiple timeframes for analysis on the right side, ranging from 2-minute to 1-week.
Indicators and Strategy Elements:
Entry & Exit Points: An entry point is marked, with a labeled Entry box, and several Take Profit (TP) levels: TP 1, TP 2, and TP 3.
Stop Loss & Trailing Stop Loss:
The initial Stop Loss is set below the Entry point.
A Trailing Stop Loss (TSL) is set above the Entry, indicated by the purple box.
Market Conditions:
The condition for most timeframes, including 2M, 5M, 15M, 30M, and 1H, shows a Buy signal.
However, the 1 Hour and 2 Hour timeframes also show a Sell signal for a short period, indicating a mixed trend in the shorter timeframes.
Trend and Market Meters:
The overall market condition is Bullish in multiple timeframes, while the shorter timeframes are experiencing a Sideway condition.
Indicators like Accumulation and Setup Buy confirm the bullish bias in larger timeframes.
Technical Indicators:
CIT (Change in Trend) signals are marked multiple times, confirming areas of trend reversal or continuation.
BOS (Break of Structure) is used to denote areas where the market broke through previous support or resistance levels.
Volume data and trend strength indicators are included below the chart, such as the AO (Awesome Oscillator) and RSI (Relative Strength Index), showing bullish strength currently.
Take Profit Levels:
TP 1, TP 2, and TP 3 are clearly defined.
TP 1 is at the 253 level, TP 2 is at 257, and TP 3 is at 261.
As the price progresses, each TP represents a strategic level to secure partial profits.
Suggested Strategy Analysis:
Entry & Stop Loss Setup:
Your Entry point is well-placed based on support/resistance confirmation.
Stop Loss placement below the support level provides a solid risk management strategy, protecting against unexpected reversals.
Trailing Stop Loss (TSL):
The use of a TSL above the Entry is designed to lock in profits as the price moves in your favor.
Consider incrementally adjusting the TSL if the price breaks above TP 1 and TP 2 to optimize gains.
Take Profit (TP) Management:
TP 1 serves as a conservative target, while TP 2 and TP 3 are positioned for higher gains.
Once TP 1 is hit, moving your Trailing Stop Loss to the Entry point is recommended, ensuring a no-loss position if the price reverses.
Market Condition Awareness:
Keep an eye on the 1-hour and 2-hour Sell signals for potential short-term resistance or pullback zones.
If these signals continue, consider scaling out partial positions at TP 1 or TP 2 and waiting for confirmation before holding to TP 3.
Final Recommendations:
Monitor for any break of support/resistance around the TP levels.
Adjust the Trailing Stop Loss dynamically as the price hits TP targets.
Use Volume and Momentum Indicators (AO and RSI) to validate the strength of the trend, especially if there are conflicting signals
Key Observations:
Chart Overview:
Timeframe: The chart is set to the 2-hour timeframe, providing an intermediate view of Tesla's price movements.
Trend: The general trend appears to be bullish, with multiple Buy signals marked throughout the chart. However, there are also short-term Sell signals at resistance levels.
Entry, Stop Loss, and Trailing Stop Loss:
Entry Point: The Entry is clearly labeled with a gray box around the 243.81 price level.
Stop Loss: The Stop Loss is set higher, around the 261.25 level. This setup suggests a larger stop loss to accommodate potential volatility.
Trailing Stop Loss: A Trailing SL is marked below the Entry, indicating that the strategy is to adjust the stop loss upward as the price moves in favor.
Take Profit Levels:
TP 1 is set at 245.
TP 2 is set at 237.
TP 3 is set at 230.
These TP levels are well-defined, suggesting a strategy of scaling out of positions at each profit target.
Support and Resistance Zones:
The chart shows multiple resistance and support zones, with areas of Buy and Sell markers based on support/resistance and trend change patterns.
Break of Structure (BOS) and Change of Character (CHoCH) signals are present, indicating shifts in trend direction.
Technical Indicators and Market Conditions:
The market meter and trend indicators show a Bullish trend across multiple timeframes (1-minute, 5-minute, 30-minute, 1-hour, and Daily).
The 2-hour and 4-hour timeframes indicate a Sell condition, suggesting caution as it may encounter resistance in the intermediate timeframe.
Current Setup Analysis:
The Buy signal at the current entry level suggests a potential reversal from the recent downtrend.
The trailing stop and support below the current price indicate a strategy focused on capturing a move back to higher resistance levels.
Strategy and Recommendations:
Risk Management:
Stop Loss placement at 261.25 is relatively wide. Consider adjusting the Stop Loss closer to the entry point if the price action shows weakening momentum.
Trailing Stop Loss should be moved dynamically as the price hits TP 1 and TP 2 to lock in profits.
Take Profit Strategy:
TP 1 at 245 is a conservative target, suitable for partial profit-taking.
As the price approaches TP 2 and TP 3, monitor volume and momentum indicators to gauge whether to hold the position for a full exit.
Potential Reversal or Continuation:
If the price breaks through the TP 1 level with strong momentum, consider adding to the position with a tight trailing stop.
Conversely, if the price struggles to hold above the 243 level, it may indicate a short-term reversal back to support.
Monitor Larger Timeframes:
With the 2-hour and 4-hour timeframes showing a Sell signal, be cautious about any unexpected resistance or trend reversal in these higher timeframes.
Wait for a clear break above the 245 resistance to confirm a bullish continuation.
Final Thoughts:
This chart is a good example of using multiple TP levels and a structured trailing stop loss strategy.
Make sure to adjust the Trailing Stop Loss dynamically to lock in gains as the trade progresses.
Keep an eye on broader market conditions for any macro changes that could impact Tesla’s overall trend.
Key Observations:
Timeframe:
The chart is set to the 1-day (Daily) timeframe, which is ideal for tracking long-term trends and investment strategies.
This timeframe provides a broader perspective compared to the previous 2-hour and 1-hour charts.
Entry, Stop Loss, and Trailing Stop Loss:
Entry Point: The Entry is clearly marked at approximately 250.08, suggesting a recent buy-in.
Stop Loss: The initial Stop Loss is set at 218.60, giving this trade a wider stop to accommodate daily fluctuations.
Trailing Stop Loss (TSL): The TSL is placed at a higher level compared to the Stop Loss, indicating that the strategy is designed to lock in gains as the price advances.
Take Profit (TP) Levels:
TP 1 is set at 269.24, providing a reasonable target for a short-term exit.
TP 2 is positioned higher at 287, indicating a more aggressive take profit target.
TP 3 is at 309, representing the maximum profit target, suggesting a strong bullish expectation if the price momentum continues.
Support and Resistance Zones:
Multiple zones are highlighted on the chart, with areas showing previous Buy and Sell signals.
BOS (Break of Structure) and CHoCH (Change of Character) markers are present, signifying areas where the trend direction shifted.
Market Meter & Condition:
Timeframe Trends and Conditions on the right panel indicate a generally Bullish condition across multiple timeframes.
1-hour timeframe shows a Sell signal, but this could be a minor pullback within a larger bullish trend.
Overall, the Market Meter suggests a continued upward momentum, with several "Running Up: Buy" conditions noted.
Indicators and Market Structure:
The chart includes indicators like CIT (Change in Trend), Break of Structure (BOS), and other technical signals to validate trade setups.
The overall structure appears to be targeting a continuation of the bullish trend with proper stop loss and take profit management.
Suggested Strategy:
Entry and Risk Management:
Your Entry at 250.08 aligns well with the recent support level, suggesting a good long entry point.
The Stop Loss at 218.60 is positioned to account for any unexpected trend reversals, maintaining a healthy risk/reward ratio.
Trailing Stop Loss Management:
As the price moves toward TP 1 at 269.24, consider moving the Trailing Stop Loss higher to at least the Entry point, ensuring a no-loss position.
If the price reaches TP 2 at 287, adjust the TSL further up to lock in more profits.
Take Profit Strategy:
TP 1: Represents a safe, short-term target. If momentum is strong, consider holding for a move to TP 2.
TP 2: At 287, represents a more aggressive profit-taking point. Partial profit-taking here is advisable.
TP 3: At 309, is the optimal exit point for the entire position, provided the bullish trend continues with high momentum.
Monitoring Market Conditions:
Keep an eye on the 1-hour and 30-minute signals, as any persistent sell signals on these timeframes might indicate a short-term pullback.
If the 1-hour Sell persists, be prepared to exit partially at TP 1 and re-enter after confirming trend continuation.
Long-Term Perspective:
The overall setup is positioned for a strong bullish continuation, with larger targets suggesting confidence in Tesla's long-term growth.
As this is the Daily chart, be patient and allow the trade to develop over time.
Potential Adjustments:
If there is a sudden shift in the market sentiment or the Daily timeframe begins to show bearish signals, consider reducing your position size or moving the Stop Loss closer to minimize risk.
Alternatively, if TP 1 and TP 2 are hit with ease, you may choose to extend the Trailing Stop Loss even further to capture a potential rally beyond TP 3.

NVDA price bounced exactly at the green zone, around 115.25. WOWThe price bounced exactly at the green zone, around 115.25. WOW, do you remember my analysis of Nvidia from last week? I can't even believe it myself; it was incredibly accurate!
Every time I apply price behavior with price action, I always remember the words of my mentor, Al Brooks. He told me: "Just remember, Mike, price action is ALWAYS RIGHT."
I believe that it's the trader who makes mistakes, not the price action, because it will always be on the correct side.
That’s why I always recommend drawing trend lines, channels, and minimizing the use of indicators that might make you see something different. This way, you'll be more accurate in your decision when executing an order.
Going back to Nvidia...
There’s something about the last candle that has me a bit uneasy. This can be very misleading because the price HASN’T BROKEN THE CHANNEL YET! The advantage we have here is that the last candle shows a buying pressure wick, but it hasn’t fully broken out of the channel or shown volume yet. However, I still believe that Nvidia will likely break out at any moment because it bounced off my green zone, as we said in the previous analysis (well before), and it didn’t even reach the #4 sequence, which would have been at the channel’s support.
Now, we just need to wait for a breakout confirmation. But what will happen after it breaks out?
We’re looking for an N3 pattern.
An N3 pattern involves three movements:
#1 Breakout and New High
#2 Pullback and Rebound
#3 New Extreme
That simple.
Will it happen? No one knows for sure. The next step is the breakout, and after that, we let the price do what it needs to do so we can position ourselves for the next move.
Stay very alert this week!
Best regards, and thank you for supporting my analysis.

$PDD to 250Cup and handle formation , target 250
PDD is currently oversold so stay cautious
Short term target = 190-195
Expected pullback area in the chart

BULLISH FLAG Pattern breakout to upper BollingerThis is a perfect set-up for a continuation of the flag pattern. An exceptionally healthy sort-out candle could see 140s before another breakdown.

GOOGL 2 VALIDATED CONFIRMATIONS! EXTREMELY BULLISH !!!!GOOGL, 2 VALIDATED CONFIRMATIONS!
Last week, I mentioned that I was extremely bullish on Google. In fact, I even sent a buy alert to my investment clients since Google has shown many bullish patterns and is displaying typical "pre-earnings" behavior. However, I have shared my analysis with you for free because I want us all to succeed! And if you've been following my analysis for months, you've seen for yourself that we’ve been on the right track.
Everything happens with Google after it breaks out of a channel. Whenever the price breaks a channel, we need to wait for it to reach its high and look for when the pullback will occur. In this case, after finding its high post-breakout, Google entered a candle congestion channel.
STACKED CHANNEL: A candle congestion channel can be considered a volume indecision. What do I mean by this?
The price creates a bottleneck-like pattern within a very tight channel, behaving strangely, with candles almost the same size and very close to one another. In this situation, it’s very difficult to determine which direction the price will take, and I consider it a complicated and dangerous pattern. All we can do is wait for the price to make a decision.
Once the price makes a decision, it breaks the congestion channel, forming a new high, and consequently, reaching our target zone. That’s precisely when it begins its pullback, and the next step we’re looking for is A NEW EXTREME.
I’ve marked this pattern in yellow, and I call it the N3 Pattern. This usually happens most of the time after a breakout, and we must be very attentive to the candles it produces to execute it.
An N3 pattern involves three movements:
#1 Breakout and New High
#2 Pullback and Rebound
#3 New Extreme
That simple.
Going back to the analysis, we’ve reached our next stop with double confirmation.
In conclusion, I remain very bullish on Google, especially as we are just a few weeks away from Google announcing its earnings report. So, if you're considering entering, whether for a swing trade or long-term, there's still time.
Remember that, based on my valuation and fundamentals, Google has an intrinsic value of $180, so the final decision is yours.
OF COURSE… This is not financial advice, and you make your own decisions and take your own risks.
Thank you for you support :)


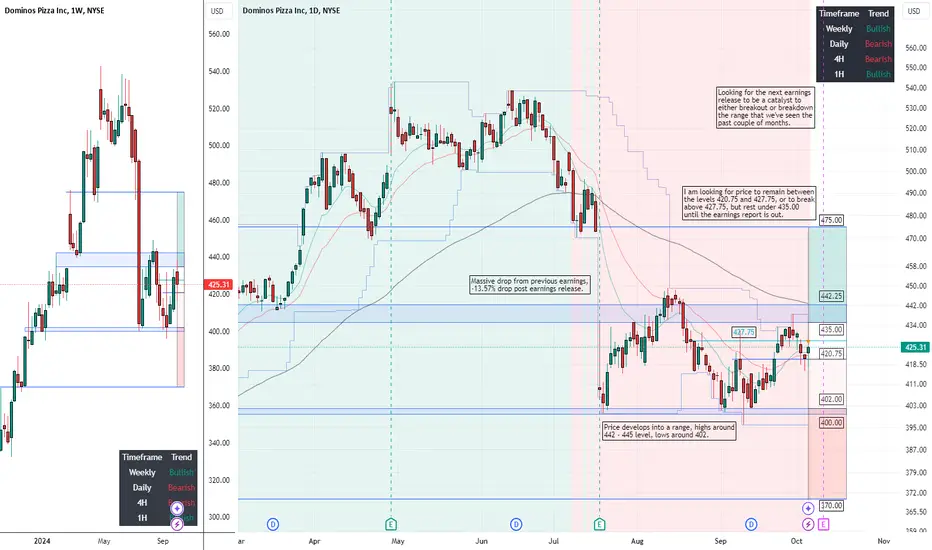
DOMINOS PIZZA $DPZ | RANGE BREAKOUT AFTER EARNINGS? - Oct 06 '24DOMINOS PIZZA NYSE:DPZ | RANGE BREAKOUT AFTER EARNINGS? - Oct 06 '24
BUY/LONG ZONE (GREEN): 435.00 - 475.00
DO NOT TRADE/DNT ZONE (WHITE): 420.75 - 435.00 (can be extended to 402.00 - 435.00)
SELL/SHORT ZONE (RED): 370.00 - 402.00 (can be extended to 370.00 - 420.75)
Weekly: DNT
Daily: Bearish
4H: Bearish
NYSE:DPZ saw a massive drop from previous earnings, -13.57% drop post earnings release. Price then develops into a range, highs around 442 - 445 level, lows around 402. I am looking for the next earnings release (Oct 10, pre market) to be a catalyst to either breakout or breakdown the range that we've seen the past couple of months. I am looking for price to remain between the levels 420.75 and 427.75, or to break above 427.75, but rest under 435.00 until the earnings report is out.
This is what I would personally look at before entering trades, everything is subject to change on a daily basis and as I analyze different timeframes and ideas.
ENTERTAINMENT PURPOSES ONLY, NOT FINANCIAL ADVICE!
trendanalysis, trendtrading, priceaction, priceactiontrading, technicalindicators, supportandresistance, rangebreakout, rangebreakdown, rangetrading, chartpatterntrading, chartpatterns, spy, sp500, s&p, fed, federalreserve, dominos, dominospizza, dpz, NYSE:DPZ , dominosearnings, earningsplay, earningstrade, dominospizzaearnings, dominospizzarange, rangetrade, earningssetup, dominospizzatrade, dominostrade, dpztrade, dpzearningsrelease, dominosiv, dominosoptions, dpzoptions, dpziv,
#Uber Uber is testing previous resistance turn support and showing bullish characteristic
Above 200 daily moving perfect risk to reward ratio
Dyor!!

Microsoft to 450 and then to 520Microsoft is at best risk to reward entry level.
Ultimate target 520
Target: 450

ANF eyes on $145 : about to Break Out from Major Resistance?Followup to my previous Swing Trade plot (click).
ANF peaked exactly at our Genesis fib at $196.93
The pullback has been strong but controlled so far.
Now trying to paint a bottom if breaks resistance.
Previous Analysis:
==================================================================
.

Microsoft Clear Long - Term Elliott Wave PatternSometimes individual stocks can have clear Elliott wave patterns. Since October 2022 Microsoft (MSFT) rallied in a clear Elliott five – wave extended Impulse pattern. The decline from its July 2024 top was impulsive followed by a clear Single Zigzag correction.
A third wave down could now be developing. If so it could break below the August bottom and reach at least a .618 retracement of the 2022 to 2024 rally.

MSTR Swing IdeaNASDAQ:MSTR , COINBASE:BTCUSD
MSTR swing idea.
Earnings are in the way here, and I have no interest in hitching a ride. The IV is jacked, but I do still like an ER run up idea, with the likely target being 200. Continued strength could see the push higher though, especially if BTC breaks out of it's falling wedge on the weekly.
Would still plan to enter at 178.24 and trim at 183.70, but I will be looking at a vert spread instead of regular calls.
Oct25 +180c/-190c for around 3.68 with the underlying at 178.24.

PFE painting a bottom? eyes on $ 28.60 immediate hurdlePFE is near Covid lows while others are flying.
No idea whats wrong or pharma/drug standing.
Chart says possible bottom or one more drop yet.
$ 28.56 - 28.63 is the immediate hurdle.
$ 28.18 - 28.26 is the current support.
$ 27.57 - 27.66 is best guess of bottom.
==========================================
.

RETRACE TO 99 on the trendline before continuationThe market has seen perfect bullish sentiment movement to the upside. It is still following the trend. The DOJI is resistant. Other indicators have room to run. The market is closing in on highs.

SBUX Swing & Day Trade IdeaNASDAQ:SBUX
2 potential setups here, one for a longer dated swing, and another for a short-dated (weeklies) day trade/scalp.
SBUX has been consolidating and grinding higher since the gap up in mid-August.
Levels are marked accordingly on the chart, but see the hourly below for the day trade look

Caterpillar (CAT): Construction Strength Amid Industrial SlumpCharting Caterpillar can be challenging, given the complexity of its price structure, but it’s fascinating to see how well it respects Elliott wave theory and trend channels. Despite the difficulties, the adherence to these principles makes the analysis quite promising.
The construction sector for Caterpillar remains robust, while the true growth catalyst is expected from a recovery in the mining industry, driven by demand from China and other regions. However, it’s not all positive: industrial activity in the U.S. has been sluggish, with the Institute for Supply Management Purchasing Managers' Index falling below 50 in 21 of the last 22 months—marking one of the worst streaks on record. This industrial downturn certainly adds pressure.
On a higher time frame, there’s not much new to add. However, we are looking for Caterpillar to move higher to complete wave (3). As shown in the zoomed-in chart (the chart in the left frame), we can observe how accurately the price is moving within the trendline. The "best-case" scenario for us would involve a push above the channel, followed by a sell-off. If this happens, it will provide a clearer indication that a larger correction—wave (4)—is imminent.

650, BE THEREThis has the upside potential to be 650, before that happens it could dip towards 450 which will be a big buying opportunity. Whether it hits 450 or not, most likely it will test its all-time highs which is 30% upside potential from current price.
Happy Trading!! Not a financial advice.

More waiting on AMCExpecting more erosion on the price for a new lower low before the next eruption, the sideways consolidation which many expected to be a continuation pattern is breaking to the downside.
The tricky thing with symmetrical triangles is that depending on where you start the count, can yield the complete opposite outcome. I think that the first move down from the peak was not part of the triangle but an A leg, continued by a B wave triangle, and now with the triangle breaking to the downside is the C leg. Expecting reversal around after the election. I will also note a huge overbought RSI on the May 14 peak which will be revisited.

AMD LONGFollower requested AMD analyze! if you want also you can DM.
This week we retested and succeeded ! next target would be 180-185 range.
expecting a small pullback when reaching 180 range and should reach the upper range 200$.
Next update when we reach 180$ range, our first target and test to see if we will continue up or fail !
TARGET 1 : 180$ area
TARGET 2 : 200$ area
* will update if there is any change in sentiment of the structure
* for any question drop them below, and HIT THE FOLLOW BUTTON

JPM Stock: 3 Steps Rocket Booster Strategy (Learn More)Am really tired because am working on writing project.Almost every morning I wake up to punching in words.
The writing formula I have but working it is very mentally hard.Maybe it's because I have recently learned
How to do it.
Learning a new strategy takes time no matter how simple.One day you will get it and look back and appreciate the effort
You put in when no one was looking or keeping you accountable.
The 🚀 Rocket booster strategy is a technical analysis tool meant to show you when a price is in an uptrend.
It's used for trend analysis.
It's a common tool in trading and is used to show beginners how to read trends.
So this is the strategy:
👉The price has to be above the 50 EMA
👉The price has to be above the 200 EMA
👉The price should "Gap" up
-
If you notice these 3 Steps on this Chart NYSE:JPM
It's showing you a Buy signal.
-
Rocket boost this content to learn more
-
⚠️ Disclaimer: Trading is risky you will lose money wether you like it or not please Learn About Risk Management And Profit Taking Strategies.

ARM LONG? SHORT?Follower requested ARM analyze! if you want also you can DM .
We are in critical point in the structure, where it determines if we are going up or down.
must watch closely in the upcoming week to see how it behaves below the line, if we retest the line again and fail we will go and retest the red area below 126-134.
And if the red line area fails-> we will be going lower and out structure would be in this case distribution.
Else we must see the price breakout of the upper line, it can continue up or retest the line.
SL BELOW 126$
TARGET 173$-187$
* will update if there is any change in sentiment of the structure
* for any question drop them below, and HIT THE FOLLOW BUTTON
