Roblox Stock Plunges 9% After Hindenburg ReportRoblox Corporation (NYSE: NYSE:RBLX ), the popular online gaming platform, suffered a sharp decline in its stock price after Hindenburg Research released a damning short report. The report accuses Roblox of inflating key metrics, persistent losses, and raising serious concerns about child safety on its platform. As both technical and fundamental indicators signal trouble, investors are now left to assess the potential fallout from these accusations.
Checkout Hindenburg's Allegations and Financial Woes
The Hindenburg Research report, published on Tuesday, sent Roblox’s stock tumbling by over 9% in premarket trading. The short seller claims that Roblox (NYSE: NYSE:RBLX ) has consistently misled investors about its Daily Active Users (DAUs), accusing the company of inflating this key metric by 25-42%. Hindenburg further suggests that many DAUs include duplicate or alternate accounts, such as bots used to "farm" in-game goods, making the reported user engagement metrics highly misleading.
Additionally, the report highlights Roblox’s persistent financial losses, stating that the company has not turned a profit since going public. Over the last twelve months, Roblox (NYSE: NYSE:RBLX ) has recorded losses totaling $1.07 billion, despite its impressive $27 billion market valuation. Hindenburg argues that Roblox’s high price-to-sales ratio of 8.6 far exceeds that of its gaming industry peers, reflecting unrealistic growth expectations.
The report also raises alarming safety concerns, alleging that Roblox’s moderation systems are insufficient to protect its predominantly young user base from exposure to inappropriate content and predatory behavior. Hindenburg claims that Roblox (NYSE: NYSE:RBLX ) has adopted a “growth at all costs” approach haha but that's insane, saying they prioritized inflated metrics over the safety of its users.
In response, Roblox (NYSE: NYSE:RBLX ) has remained silent, declining to comment on the report. This lack of transparency has only added to investor concerns, as shares continued to fall throughout the trading session.
Technical Outlook
From a technical perspective, Roblox's stock is exhibiting significant weakness. After forming a bullish flag pattern in early September 2023, which suggested a potential upward move, the pattern ultimately failed as the ceiling of the flag broke down following so many factors Ps the release of the Hindenburg report. The stock is now trading within a falling wedge pattern, a typically bearish formation.
As of the time of writing, NYSE:RBLX is down 4%, with the stock trending lower over the past few sessions. The moving averages (MA) are beginning to form a “dead cross” pattern, where the short-term moving average crosses below the long-term moving average. This is a classic indicator of potential extended bearish momentum in the coming weeks.
The Relative Strength Index (RSI) currently sits at 30.76, just above the oversold threshold of 30. While an RSI this low can sometimes signal an opportunity for a reversal, the broader technical landscape suggests that Roblox’s stock may continue to face downward pressure. Moreover, the recent candlestick pattern shows a bearish harami, which further indicates that a reversal is unlikely in the near term.
Conclusion
Hindenburg Research's scathing short report has undoubtedly shaken investor confidence in Roblox (NYSE: NYSE:RBLX ). Too sad hoping it won't affect our gaming experience. The allegations of inflated user metrics, persistent financial losses, and safety concerns present significant risks to the company's reputation and growth trajectory. Roblox’s financial struggles, including its failure to turn a profit, are compounded by an overvalued stock price, making it increasingly vulnerable to further downward pressure.
From a technical standpoint, the stock’s current position within a falling wedge pattern and the emerging dead cross signal additional bearish momentum. With the RSI hovering near oversold levels and no clear signs of a reversal, Roblox may continue to slide in the short term.
Investors should exercise caution and closely monitor how Roblox (NYSE: NYSE:RBLX ) responds to these allegations. Until the company can provide clarity or address the concerns raised by Hindenburg, NYSE:RBLX may face continued volatility. Long-term investors may want to wait for more stability in both the company's fundamentals and its stock chart before considering any moves.

$IMKTA Value PlayTrade Details:
Valuation - 110$
Target - 125$
Term - Around 2 years
Fundamental Factor Scores:
Valuation score - 8/10
Risk score - 8/10
Growth Score - 7/10
Technical Analysis Score - 9/10
Moat - None
This is not Financial Advice

$ETSY LONGS @ $40Price is approaching "covid" levels.
Mitigating orders from the sell-off could create some heavy momentum to the upside.
EASY and conservative +50%, could see price back at $200 in a few years.

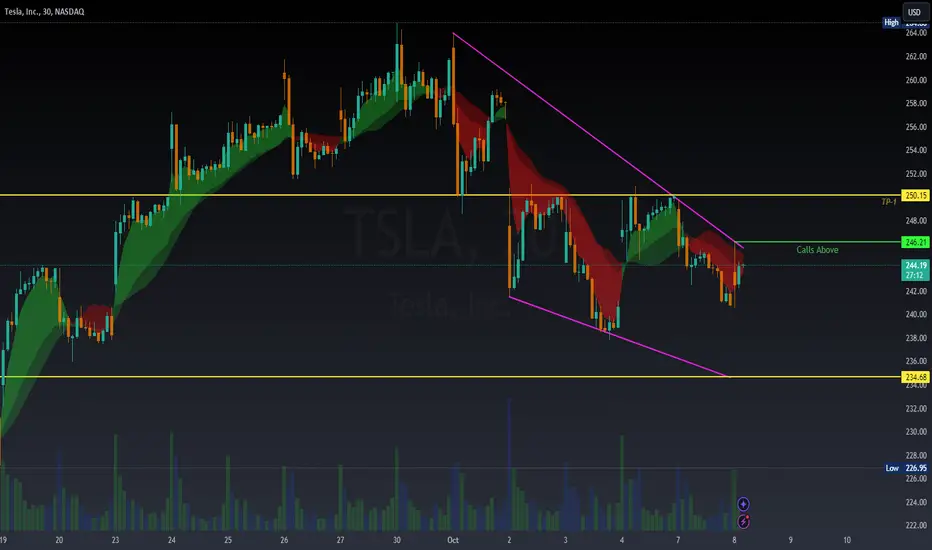
TSLANice Wedge forming on TSLA. CALLs could work over the green line. Target price mentioned.
***NOT A FINANCIAL ADVICE***

Ford Motor Could Be Skidding LowerFord Motor fell sharply over the summer, and now traders may think it will keep skidding lower.
The first pattern on today’s chart is the bearish gap on July 25 after earnings and revenue missed estimates. That potentially reflects concerns about its growth and profitability.
Next, F's 50-day simple moving average (SMA) had a “death cross” below the 200-day SMA the following month. That may suggest its longer-term trend has turned bearish.
Third is the pair of monthly highs around $11.28 in August and September. The resulting double top, below the pre-earnings lows, may suggest new resistance has developed below old support.
Next, the series of lower highs in the last three weeks has created a potential bearish descending triangle for the automaker.
Finally, the 8-day exponential moving average (EMA) is below the 21-day EMA and prices are below the 50-day SMA. Those patterns may reflect bearishness in the short and intermediate terms.
TradeStation has, for decades, advanced the trading industry, providing access to stocks, options and futures. If you're born to trade, we could be for you. See our Overview for more.
Past performance, whether actual or indicated by historical tests of strategies, is no guarantee of future performance or success. There is a possibility that you may sustain a loss equal to or greater than your entire investment regardless of which asset class you trade (equities, options or futures); therefore, you should not invest or risk money that you cannot afford to lose. Online trading is not suitable for all investors. View the document titled Characteristics and Risks of Standardized Options at www.TradeStation.com . Before trading any asset class, customers must read the relevant risk disclosure statements on www.TradeStation.com . System access and trade placement and execution may be delayed or fail due to market volatility and volume, quote delays, system and software errors, Internet traffic, outages and other factors.
Securities and futures trading is offered to self-directed customers by TradeStation Securities, Inc., a broker-dealer registered with the Securities and Exchange Commission and a futures commission merchant licensed with the Commodity Futures Trading Commission). TradeStation Securities is a member of the Financial Industry Regulatory Authority, the National Futures Association, and a number of exchanges.
TradeStation Securities, Inc. and TradeStation Technologies, Inc. are each wholly owned subsidiaries of TradeStation Group, Inc., both operating, and providing products and services, under the TradeStation brand and trademark. When applying for, or purchasing, accounts, subscriptions, products and services, it is important that you know which company you will be dealing with. Visit www.TradeStation.com for further important information explaining what this means.

Yet another LOVEly setup. NVDA to 200 roughy before June 2025.NVDA will take the market by storm. Only now will people care though because Jimmy Cramer says so LOL
We knew way before. VPA is king and showed bullish strengths while exposing bearish weaknesses
Order flow, premium, and open interest of contracts all confirm this
See you guys at $280 around 2026 ;)

A BloomZ Inc. (NASDAQ: BLMZ) Update: Growth, Strategic Alliances
BloomZ Inc. (NASDAQ: BLMZ) , a Japanese audio production and voice actor management company, has been making notable moves in 2024. The company, which went public on NASDAQ in July, has been actively expanding its operations and forming key strategic alliances. Recently, BloomZ reported a significant 39.3% year-on-year increase in its audio production and talent management business, alongside a remarkable 209.8% rise in its internet business.
In terms of strategic growth, BloomZ has entered into several alliances. In September, it announced a business partnership with CrossVision to jointly develop entertainment offerings. This comes alongside a separate collaboration with sonilude Inc., focusing on producing original animation projects, which further underscores BloomZ's commitment to expanding its creative footprint.
However, BloomZ has also faced challenges. The company received a notification from Nasdaq regarding its market value, signalling the need for improved financial performance to meet minimum listing requirements.
Despite these hurdles, the company's proactive growth strategy through partnerships and sector expansion suggests it is aiming to overcome these obstacles and solidify its position in the entertainment industry.
Investors are watching closely to see how BloomZ navigates both its growth potential and financial challenges in the coming months.

$LYFT Breaks Downtrend LineNASDAQ:LYFT I thought I published this idea back on September 17th when I went long. I started with a ½ size position on that date. I added additional shares on Monday the 23rd and again yesterday to bring it up to a full-size position. I am now hoping it will consolidate some of these gains. This is one I plan on trading around, meaning I may take some profits and look to add back or if it does not fall below the 5 DMA (white) and simply consolidates there I may simply add. It looks to me that NASDAQ:LYFT “could” run to the $15 area before hitting any resistance. All TBD.
On a side note, were I just seeing this, I would wait for some consolidation or a pullback before entering a position.
Ideas, not investing / trading advice.

The "saga" continuesLack of volume!
It "could" jump up, but I don`t think so.. 50-62% is so called healthy , but 72 is kind a suspicious..
Trade safe!

Covered call on TSLA over ROBO TAXII am expecting robo taxi to be a "sell the news" event. We had a "buy the rumor move" on TSLA from $200 to $260
I had a $250 covered call expiring LAST Friday. I sold that for $5 and bought it back for $1. NICE WIN. Still have the shares.
So, figured If I was OK selling at $250 2 trading days ago, I should be fine selling at $255+4 = $259 effective
THIS FRIDAY

How FOMO Can Kill a Trader’s Gains!FOMO, or the Fear of Missing Out, is a feeling many traders know well. It’s that worry that you’re missing a big opportunity while others are making money. While it’s natural to want to jump in, FOMO can lead to bad decisions that erase months of hard work (unfortunately, this is from a personal experience). In this article, we’ll explain why FOMO is dangerous, how it traps traders, and how you can avoid it.
The NASDAQ:NVDA Story: How FOMO Wiped Out 3 Months of Gains
Let’s say you’ve been trading carefully for three months, making steady progress. Then one day, you see headlines everywhere: “NVIDIA ( NASDAQ:NVDA ) stock is soaring!” Everyone’s talking about it on social media, and people are posting their big profits.
You start feeling anxious. You didn’t plan to trade NVDA, but the fear of missing out kicks in. You decide to buy the stock, even though it’s already at its highest point.
But soon after, the stock price drops, and you’re stuck with big losses. In just a few days, the gains you worked hard for over three months are gone—all because FOMO made you jump in without thinking.
What Causes FOMO?
Here are some common things that trigger FOMO in traders:
Social Media: Seeing others bragging about their gains makes you feel like you’re missing out.
Market Buzz: When everyone is talking about a stock, it feels like you have to act fast or you’ll lose your chance.
Seeing Others Profit: Watching friends or other traders make money makes you question your own strategy.
Overconfidence: After making a few good trades, you might start thinking you can time the market perfectly.
Fear of Falling Behind: You don’t want to be the only one not making money, so you make impulsive trades.
How Retail Traders Fall for FOMO
FOMO is especially tough on retail traders, who are often newer to the market. Here’s how it usually happens:
Following the Crowd: Instead of doing their own research, traders jump into stocks because everyone else is.
Impulse Decisions: They buy stocks based on emotion, not logic or analysis.
Chasing Losses: After losing money in a FOMO trade, they take even more risks to try and win it back.
This kind of behavior can lead to bigger and bigger losses, making it hard to recover.
Here are 5 tips that I hope can help you avoid FOMO in trading:
Have a Plan
Before you start trading, make a clear plan. Know when you’ll buy, when you’ll sell, and stick to it. This helps you avoid getting swept up in hype.
Limit Market Noise
Avoid spending too much time on social media or reading news that hypes up stock movements. It’s easy to get influenced, but remember, your strategy is more important than others’ excitement.
Set Realistic Goals
Whether trading short-term or long-term, focus on consistent, well-planned trades. For short-term traders, aim for steady, smaller gains rather than chasing quick profits. Stick to reliable setups that match your strategy.
Manage Your Emotions
Take a step back and think before making decisions. Don’t let fear or excitement control your trades. Stay calm and follow your plan.
Learn from Mistakes
Everyone makes mistakes in trading. What matters is learning from them. Instead of rushing into more trades to recover, reflect on what went wrong and how to avoid it next time.
Takeaway
FOMO can lead to bad decisions and wipe out months of progress. The fear of missing a big opportunity is strong, but chasing after hyped stocks can backfire. By staying disciplined, keeping your emotions in check, and following a solid trading plan, you can avoid the traps of FOMO and keep building your gains over time.

PepsiCo Stock Struggles Amid Weak Revenue and Guidance CutPepsiCo Inc. (NASDAQ: NASDAQ:PEP ) has long been a staple of the food and beverage industry, with a reputation for consistent growth and strong brand recognition. However, recent performance suggests a slowdown in momentum, as both technical indicators and fundamental data point to challenges ahead for the stock.
Declining Revenue and Softened Outlook
On Tuesday, PepsiCo (NASDAQ: NASDAQ:PEP ) reported its fiscal third-quarter results, revealing a mixed performance that failed to meet Wall Street's expectations. The company posted earnings per share of $2.31, narrowly surpassing analyst expectations of $2.29, but its revenue of $23.32 billion fell short of the anticipated $23.76 billion ugh too bad. This marks a 0.6% decline in net sales compared to the same quarter last year.
The revenue shortfall is largely attributed to the impact of product recalls in its Quaker Foods North America division, a key segment of the company’s portfolio. Quaker Foods saw a 13% volume drop following recalls related to salmonella contamination and the subsequent closure of a production facility. The weakening demand in the U.S. market, alongside disruptions in international markets such as Latin America and the Middle East (Tensions between Israel, Iran and Lebanon), exacerbated PepsiCo's woes.
PepsiCo CEO Ramon Laguarta acknowledged the challenges, noting that weaker-than-expected sales, particularly in its snack and beverage divisions, have weighed heavily on the company's outlook. As a result, PepsiCo (NASDAQ: NASDAQ:PEP ) trimmed its full-year organic revenue growth forecast, now expecting only a low-single-digit rise, down from the previous 4% projection.
Moreover, despite some resilience in brands like Gatorade and Pepsi within the North American beverage segment, overall volume declined by 3%, underscoring the broader slowdown in consumer demand. Rising inflation and shifts in consumer behavior have prompted shoppers across various income levels to cut back on discretionary spending, especially on premium products.
Let's check out what the Technical data says
From a technical perspective, PepsiCo’s stock is reflecting the underlying weaknesses in its business. After consolidating within a tight range for much of the year, NASDAQ:PEP has now formed a bearish reversal pattern, signaling the potential for further downside.
As of the latest premarket trading, the stock is down 0.66%, and its technical indicators suggest that more selling pressure may be on the horizon. The relative strength index (RSI) stands at 32.74, inching closer to the oversold territory, which reflects a growing bearish sentiment. An RSI reading below 30 typically indicates that a stock is oversold, but NASDAQ:PEP is dangerously close to crossing that threshold, which could spur a wave of panic selling.
Furthermore, PepsiCo's stock is currently trading below its key moving averages, with the 50-day, 100-day, and 200-day moving averages converging at a critical juncture. When these averages converge and begin to trend downward, it often signals that a stock could face extended bearish momentum. In this case, the bearish crossover suggests that NASDAQ:PEP may experience further downside movement in the near term.
The stock is also hovering near a crucial support level at $158, a pivot point that, if breached, could open the door to a steeper decline. Should NASDAQ:PEP break below this support, it may revisit its recent lows, potentially entering a more prolonged bearish trend.
Conclusion: A Cautious Outlook for PepsiCo Investors
PepsiCo's (NASDAQ: NASDAQ:PEP ) revised guidance for organic revenue growth indicates that management is bracing for slower growth ahead, and this cautious outlook has weighed on investor sentiment.
From a technical standpoint, PepsiCo’s stock appears vulnerable to further declines, with bearish patterns and weak momentum pointing to the possibility of additional downside. The stock's proximity to a critical support level at $158, coupled with a low RSI and downward-trending moving averages, suggests that investors should exercise caution.
PepsiCo (NASDAQ: NASDAQ:PEP ) may face headwinds in the coming months. While the company remains a long-term blue-chip investment, short-term traders and investors should monitor the stock closely for any signs of a reversal, particularly if the stock breaches its key support level. Until the company can demonstrate stronger revenue growth and address its operational challenges, NASDAQ:PEP may continue to underperform relative to market expectations.

Massive retest of lows very likelyLook at the draw downs historically for this China bear market. None of them have held and all led to lower lows. I should hope that everyone using this platform understands one thing, Govt intervention never will work in propping up a market for long.

Buy CorpayShort Term Trading Advice by Naranj Capital
Buy Corpay
● Buy Range- 326 - 332
● Target- 345 - 348
● StopLoss- 315
● Potential Return- 4-5%
● Duration- 14-15 Trading Days

PLTR which side of this trade are you onUpdated, alleged mild slope channel. This is a massive slope, waaaaaaay overboard to the upside. I still think we see 32$ in the coming weeks, the RSI is way overheated, volume is not great either.

JP Morgan priced in goldNot many are watching this...
Incoming "capital rotation event" tidal wave!
#silver #gold #banks

10/07/2024 - Here is a new SELL breakout chosen by computer scanStop: 371.96
Entry: 345.14 or lower
Target: 317.45

AMD - 4h - RSI DivergenceAMD Shares Alert: Potential Decline or Fakeout?
Advanced Micro Devices Inc. (NASDAQ: AMD) could see its shares drop to $150.00, with a divergence on the Relative Strength Index (RSI) suggesting a decline.
However, this could also be a potential fakeout from the asymmetric triangle pattern recently detected.
Keep an eye on this critical support level!

AMD broke above the Lower Highs and confirms a massive rally.It's been a while (August 13, see chart below) since we last looked into the Advanced Micro Devices (AMD), which was a strong long-term buy signal, with the price reacting very favorably, having already started its new Bullish Leg:
Today we take it to the 1D time-frame where where the scale of where the price might be compared to the previous two mega rallies since the October 13 2023 bottom, may be clearer. Remarkably, the last two rallies were both of around +142%. In symmetrical terms we are around the 0.618 Fibonacci level mark where both Bullish Legs had a technical pull-back.
The key bullish development of last week though has been the break above the Lower Highs trend-line, which in line with previous Legs, has been the confirmation of the start of the long-term rally. As a result, we have now validated that the Bearish Leg is behind us and any pull-backs this structure gives, will be buy opportunities.
Our Target is intact at $295.00.
-------------------------------------------------------------------------------
** Please LIKE 👍, FOLLOW ✅, SHARE 🙌 and COMMENT ✍ if you enjoy this idea! Also share your ideas and charts in the comments section below! This is best way to keep it relevant, support us, keep the content here free and allow the idea to reach as many people as possible. **
-------------------------------------------------------------------------------
💸💸💸💸💸💸
👇 👇 👇 👇 👇 👇


IREN's most important channel to watch!Hello Tradingview community!
As always: If this pattern I'm showcasing doesn't work as predicted..
then please don't come crying to me (ty) -> NFA DYOR
Alright the channel/chart explains itself as you can tell
But here is my short description:
This chart has been respected for 2 years now and still is -
What targets do I have for EOY?
Well anything from bearish 7ish to even bullish 25ish
But my conservative target is 14-15 dollars EOY (NFA)
BOOST and follow for more!
NFA DYOR <<<-----

Apple Inc . NASDAQDear Traders,
I hope you are having a good time.
Apple Chart Analysis: After a period of upward movement and growth, it has now been 84 days since this stock has been unable to surpass its previous peak. This situation has arisen due to liquidity shortages. At first, we witnessed the breaking of the strong daily trend line, and despite the collection of liquidity from the block decisional, this stock has still failed to break through the ceiling. Ultimately, the second trend line, which I did not draw to avoid cluttering the chart, was broken, leading to a correction.
Considering last week's pullback, as expected, the movement of this stock has begun to head downward, and we are seeing very strong confirmations in this regard. We will be waiting to buy again at the extreme order block, which will be the first buying target on this chart.
I have constructed the chart in a simple and straightforward manner to facilitate easy use and benefit for you, my dear friends.
Thank you,
Fereydoon Bahrami
"A retail trader in the Wall Street trading center (Forex)."
